Fuel characteristics

 
Berechnung

Gaseous fuels

Excess air

λ

x =

Standard density, air

ρn,A [kg/m³n,A]

1.293

Material value

Unit

Natural gas
L

Natural gas
H

Propane

Propane
Butane

Butane

Natural gas
GZ35

Natural gas
GZ41.5

Natural gas
GZ50

Net calorific value

Hi

kWh kgF

10.65

13.20

12.87

12.83

12.70

7.98

9.65

10.86

Hi

kWh n,F

8.83

10.35

25.89

27.96

34.39

7

8

9

Gross calorific value

HS

kWh kgF

11.80

14.62

13.98

13.92

13.75

8.86

10.80

12.01

HS

kWh n,F

9.78

11.46

28.12

30.34

37.23

7.77

8.95

9.95

Fuel standard density

ρn,F

kg n,F

0.829

0.784

2.011

2.18

2.708

0.877

0.829

0.829

Stoichiometric air
demand

LST

kgA kgF

13.10

16.24

15.57

15.51

15.36

9.84

13.10

13.10

Standard density,
flue gas

ρ>n,FG,st

(λ=1)

kg n,FG

1.2366

1.2374

1.2650

1.2664

1.2699

1.2346

1.2366

1.2366

Standard density,
flue gas

ρn,FG

(λ=x)

kg n,FG

1.2451

1.2459

1.2693

1.2706

1.2735

1.2432

1.2451

1.2451

Wobbe index

Wi

kWh

11.03

13.29

20.76

21.53

23.76

8.50

9.99

11.24

Dew point

tCo

°C

56.9

57.0

53.1

52.9

52.4

56.7

56.9

56.9

Water generation1)

wspec,H2O

gH2O kWh

159.4

158.5

126.9

125.4

122.0

161.8

176.0

156.4

CO2 emissions1)

wspec,CO2

gCO2 kWh

201.3

202.6

232.6

234.3

238.5

197.6

222.2

197.5

SO2 emissions1)

wspec,SO2

mgSO2 kWh

0.0

0.0

0.0

0.0

0.0

0.0

0.0

0.0

Flue gas mass flow rate1)

spec

kgFG kWh

1.570

1.552

1.529

1.529

1.530

1.605

1.733

1.540

Liquid fuels

 
Berechnung

Liquid fuels

Excess air

λ

x =

Standard density, air

ρn,A[kg/m³n,A]

1.293

Material value

Unit

Fuel oil EL

Fuel oil EL,
lowsulphur

Fuel oil SA

Medium fuel oil HL
Schwechat

Medium fuel oil
CLU3

Net
calorific value

Hi

kWh kgF

11.89

11.89

11.28

11.64

11.40

Hi

kWh I

9.91

9.91

10.98

9.70

10.59

Gross
calorific value

HS

kWh kgF

12.70

12.70

11.96

12.38

12.05

HS

kWh I

10.59

10.59

11.64

10.32

11.19

Fuel standard density

ρn,F

kg

833.6

833.6

973.6

833.6

928.6

Stoichiometric
air demand

LST

kgA kgF

14.45

14.46

13.89

14.19

13.71

Standard density
flue gas

ρn,FG,st (λ=1)

kg n,FG

1.2923

1.2923

1.3063

1.2996

1.3097

Standard density
flue gas

ρn,FG (λ=x)

kg n,FG

1.2924

1.2924

1.3042

1.2985

1.3071

Dew point

tCo

°C

48.6

48.6

46.0

47.2

45.4

Acid dew point

tacid cond

°C

124.0

97.3

136.4

123.2

141.5

Water generation1)

wspec,H2O

gH2O kWh

100.5

100.5

88.7

93.7

83.9

CO2 emissions1)

wspec,CO2

gCO2 kWh

266.4

266.9

285.2

275.8

280.6

SO2 emissions1)

wspec,SO2

mgSO2 kWh

108.4

2.6

597.9

99.2

1,213.8

Flue gas mass flow rate1)

spec

kgFG kWh

1.542

1.543

1.567

1.548

1.531

Dew point of flue gases

Minimum feed water temperature as a function of fuel sulphur content

Minimum feed water temperature as a function of fuel sulphur content

Fuel oil SA


Fuel oil S


Pinch-point diagrams, boiler system

Pinch-point diagram for gas

Pinch-point diagram for gas

Pinch-point diagram for gas

Boiler

Boiler + economiser

Boiler + economiser + condensing heat
exchanger (with z = 0.3 / α = 12%)

Boiler + economiser + condensing heat
exchanger (with z = 0.5 / α = 20%)

Boiler + economiser + condensing heat
exchanger (with z = 1 / α = 34%)

Boiler + economiser + air preheating
(20°C to 65°C)

Boiler + economiser + feed water cooling
(with z = 0.3)

Example:

KCondensate accumulation rate

c = ṁCo / ṁS

Make-up water rate

z = 1 – c

UL-S

10,000 x 16

System steam output

10,000 kg/h with pavg = 13 bar

Surface blowdown rate

5 %

Case

Component

                   Efficiency


Component parts

Total

1

Boiler

88.9 %

---

2

Boiler + economiser

88.9 % + 6.5 %

95.4 %

3

Boiler + economiser + condensing heat exchanger
(with z1) = 0.3 / α2) = 12 %)

88.9 % + 6.5 % + 2.8 %

98.2 %

4

Boiler + economiser + condensing heat exchanger
(with z = 0.5 / α = 20 %)

88.9 % + 6.5 % + 3.8 %

99.2 %

5

Boiler + economiser + condensing heat exchanger
(with z = 1 / α = 34 %)

88.9 % + 6.5 % + 7.6 %

100.9 %

6

Boiler + economiser + air preheating
(20°C to 65°C)

88.9 % + 6.5 % + 1.7 %

97.1 %

7

Boiler + economiser + feed water cooling
(with z = 0.3)

88.9 % + 6.5 % + 0.6 %

96.0 %

Case studies for combinations of measures for optimum heat recovery

1) z = make-up water rate

2) α = condensate accumulation rate

Pinch-point diagram for oil
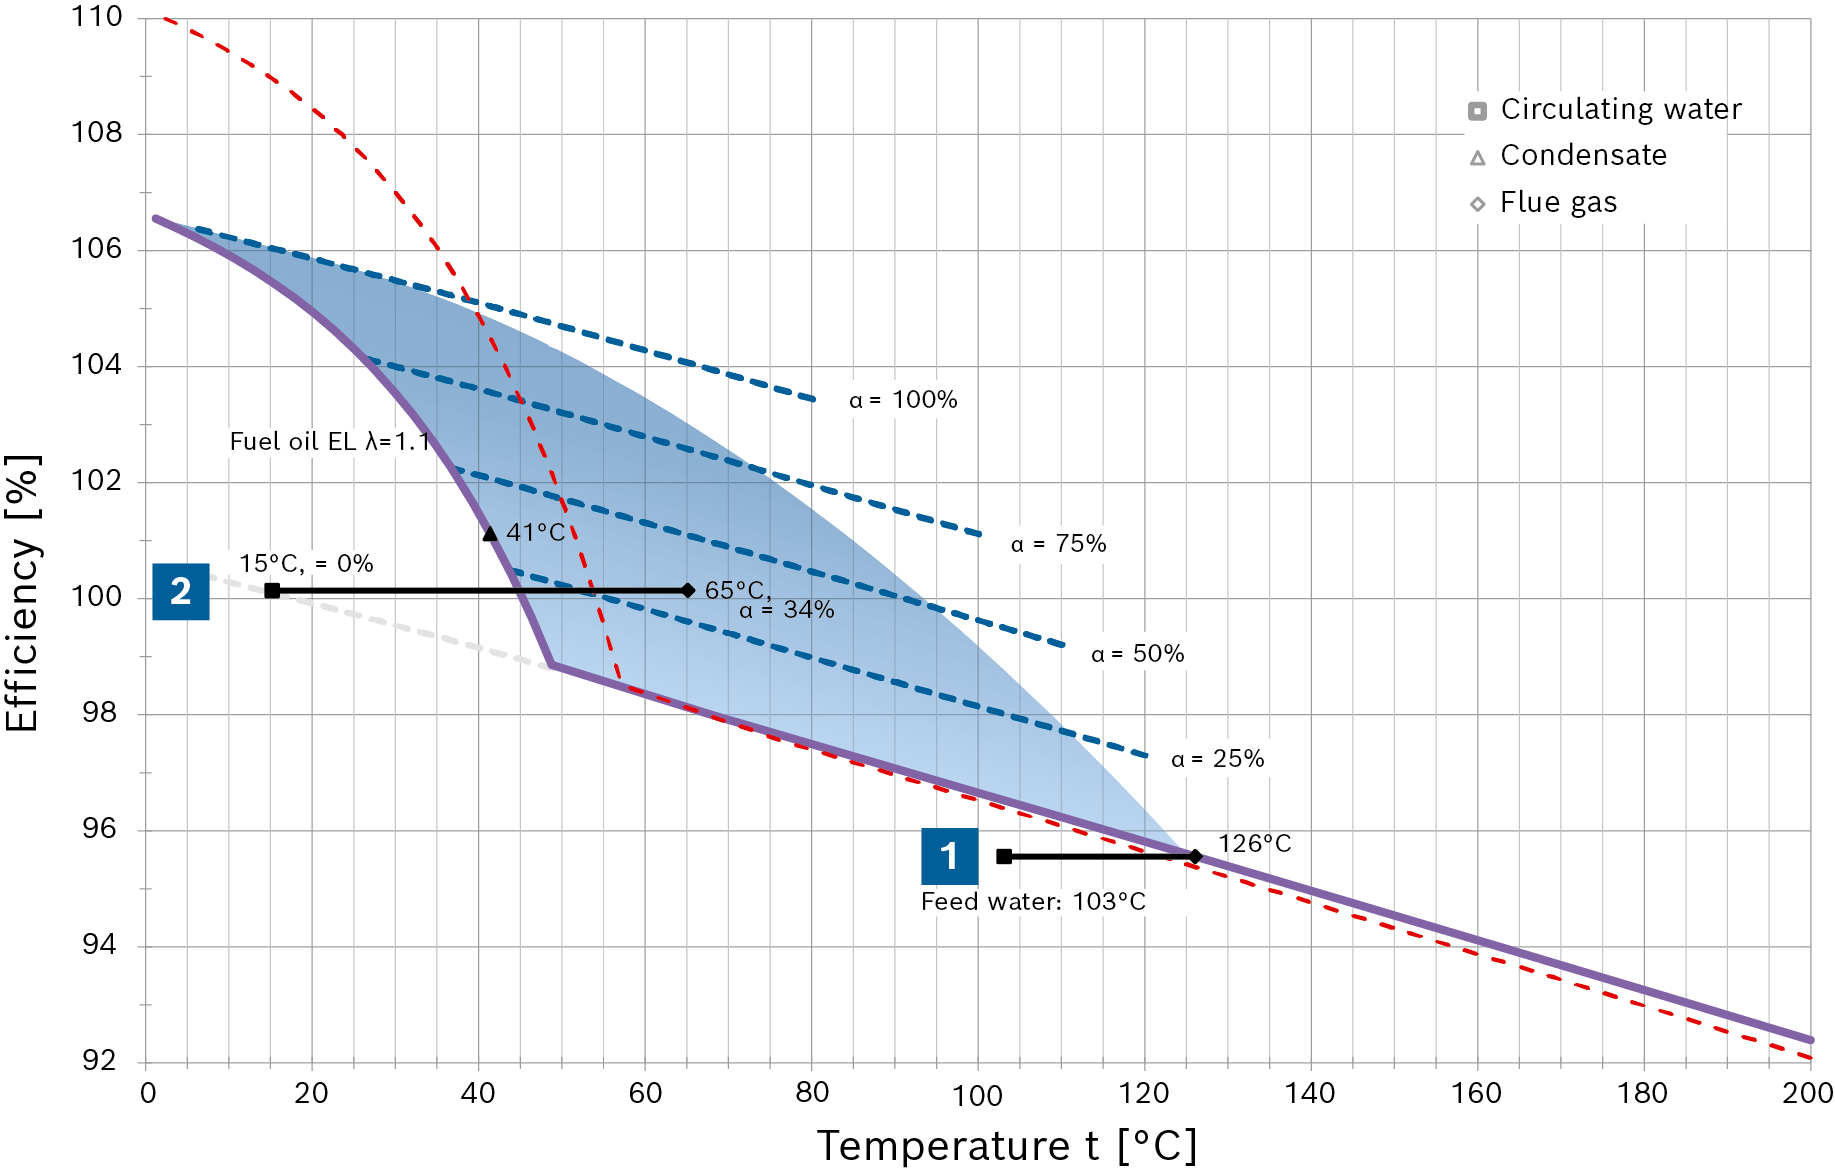
Pinch-point diagram for oil

Pinch-point diagram for oil

Boiler


Boiler + economiser